

The Failure Wasn’t Sudden: The Cooling Warning Signs Everyone Missed
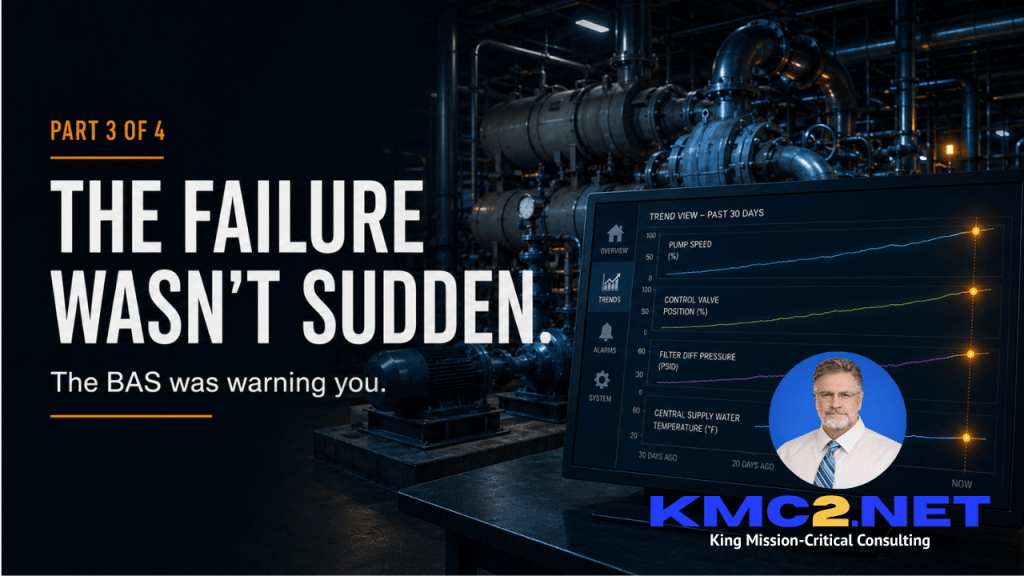
Part 3 of 4 — The evidence was there before the downtime
Mission-critical cooling systems rarely fail without warning. The evidence often appears weeks earlier in pump speed, valve position, differential pressure, recovery time, and operator workarounds—if anyone knows how to connect it.
Forty-three days before the cooling failure, nothing was broken.
The following scene is a composite drawn from patterns I have encountered across mission-critical cooling systems.
The lead chiller was online. The pumps were running. Supply-water temperature was on setpoint. No critical alarm demanded immediate action.
But the system had started leaving clues.
Differential pressure across a filtration point was gradually increasing. A pump that normally maintained system pressure in the low-40-Hz range was now operating in the upper 50s. Several remote control valves that had historically settled near 50% were regularly above 80%.
A low-flow warning appeared, then cleared without intervention.
During the next equipment rotation, the standby chiller started successfully but took longer than usual to stabilize. An operator wrote a brief note:
System seems touchy after changeover.
Each condition received a reasonable explanation.
The filters were loading but had not reached the replacement threshold. The pump was responding to demand. The valves were open but not fully open. The warning had cleared. The standby chiller had started.
No individual value crossed the line between acceptable and failed.
At 2:17 a.m., a normal load change pushed the system through that line.
Temperatures at several critical loads began to rise. The central plant still showed acceptable supply-water temperature. Both pumps were available. The lead chiller remained online. The standby machine had received its command.
The operators could see that cooling was being produced.
They could also see that the critical loads were not receiving enough of it.
The event would later be described as a sudden cooling failure.
It was not sudden.
The downtime began at 2:17 a.m. The failure had been developing for weeks.
Stay with this story, because the most important warning was not an alarm. It was a relationship between several normal-looking values that no one had placed on the same timeline until after the critical loads were affected.
The Next Gap in Mission-Critical Commissioning
In Part 1 of this series, I examined how a system can pass commissioning while carrying a design or operational assumption that makes future failure almost inevitable.
In Part 2, I looked at the gap between commissioning conditions and real operating conditions: clean filters versus loaded filters, staged tests versus changing loads, and equipment that starts successfully but does not stabilize the system.
Part 3 addresses the next question:
If the weakness is already developing, how do owners recognize it before it becomes downtime?
The answer is rarely found in one alarm or one failed component.
It is found in changing relationships.
How much harder is the pump working to maintain the same pressure?
How much farther must a control valve open to serve the same load?
How quickly is filter differential pressure increasing?
How long does the system take to recover after a transition?
How often are operators intervening to keep equipment stable?
The system may still be operating, but the amount of effort required to keep it operating is increasing.
That is often the first sign that usable margin is disappearing.
Warning Sign 1: The System Is Working Harder to Produce the Same Result
A pump-speed increase is not automatically a problem. Loads change, valves reposition, and variable-frequency drives are supposed to respond.
The warning appears when pump speed increases without a corresponding increase in useful output.
Suppose a pump historically maintained the required differential pressure at 42 Hz under a representative load. Several months later, it requires 58 Hz under a similar load and operating mode.
The pump has not failed. It is doing exactly what the control loop commands.
But something in the system has changed.
Possible causes include:
- Increasing filter or strainer resistance
- Heat-exchanger fouling
- A bypass allowing unintended flow
- A pressure sensor drifting
- A valve failing to reach its commanded position
- A change in system balance
- Additional loads that were never incorporated into the operating baseline
Pump speed alone will not identify the cause. But the change from established normal behavior tells the owner where to start looking.
This is why equipment status is not enough.
A BAS point showing Pump Running answers only one question. It does not show how close the pump is to its limit, how much its operating point has changed, or whether it is producing the same result it produced six months ago.
The more useful question is:
How much effort is the system using to maintain the required performance—and is that effort increasing?
Warning Sign 2: Control Valves Are Running Out of Authority
Control-valve position is one of the most valuable and frequently underused indicators in a hydronic cooling system.
A valve operating near 90% open is not necessarily a problem. It may be responding correctly to a high load.
But if a valve that historically operated between 45% and 60% begins spending more time above 80% without a comparable change in load, something deserves attention.
The valve is effectively saying:
I am asking for more, but I am not receiving the same result.
That can indicate insufficient differential pressure, increasing downstream resistance, fouling at the served equipment, flow-distribution changes, sensor error, or a loss of central-plant capacity.
One valve drifting open may indicate a local issue.
Several valves opening farther at the same time suggest a system-level change.
This is where trend relationships become more valuable than individual alarm thresholds.
A valve can remain below its high-position alarm. A pump can remain below maximum speed. Filter differential pressure can remain below the service limit. Supply-water temperature can remain on setpoint.
Yet when all four values move in the wrong direction together, the system is telling a very different story.
No single component has failed.
The operating envelope is shrinking.
Warning Sign 3: The Plant Looks Good While the Critical Load Is Losing Ground
One of the most dangerous assumptions in mission-critical cooling is that acceptable supply-water temperature at the central plant proves adequate cooling at the load.
It does not.
The chiller can produce the correct leaving-water temperature while a remote tool, cooling skid, imaging system, laboratory process, or data-hall cooling device receives inadequate flow.
The central plant sees production.
The critical equipment experiences delivery.
Those are not the same measurement.
A reliable trend strategy must therefore look beyond the chiller plant. Depending on the application, that may include:
- Supply and return temperature at critical branches
- Differential pressure near hydraulically remote loads
- Flow at essential equipment where reliable measurement is available
- Control-valve position
- Heat-exchanger approach temperature
- Equipment inlet and outlet temperature
- Local low-flow or high-temperature warnings
- The difference between plant response and load response
The timing between these values matters.
If pump speed increases immediately but remote differential pressure recovers slowly, the system has a delivery problem.
If plant supply temperature remains stable while tool return temperatures climb, the system may have a flow-distribution or heat-transfer problem.
If a standby chiller starts but critical-load temperature continues rising for several minutes, the changeover may be successful from the equipment’s perspective and unsuccessful from the owner’s perspective.
The owner does not need a chiller that starts.
The owner needs a critical load that remains protected.
Warning Sign 4: Maintenance Intervals Are Quietly Compressing
A shortening maintenance interval is more than a maintenance problem. It can be an early warning that the operating environment no longer matches the assumptions used during design and commissioning.
A system may be turned over with filter service expected every several months. Later, filters or strainers require attention every 30 to 60 days.
The immediate response is often to update the maintenance schedule.
That may be necessary, but it is not a root-cause analysis.
The more important questions are:
- What is causing the accelerated loading?
- Is the material construction debris, corrosion product, biological activity, or something else?
- How much differential pressure can the system tolerate before critical loads lose flow?
- Which loads will be affected first?
- Does the BAS provide enough warning?
- How much hydraulic margin remains between the new service interval and an actual process interruption?
The rate of change can matter as much as the final reading.
A filter differential-pressure alarm tells the operator when a fixed limit has been reached. A trend shows whether it took six months, six weeks, or six days to get there.
That difference can expose a much larger reliability issue.
If the maintenance interval is repeatedly shortened without investigating why, the organization may become extremely efficient at treating a symptom while the underlying condition continues to worsen.
Warning Sign 5: Recovery Is Taking Longer
Mission-critical systems are frequently judged by whether standby equipment starts.
That is only the beginning of the test.
The more important measurement is recovery time.
How long does it take to restore stable pressure, flow, temperature, and control after:
- A lead/lag rotation
- A chiller changeover
- A pump transition
- A brief power interruption
- A sudden load increase
- A maintenance isolation
- A control-mode change
A sequence that once stabilized in two minutes may later require five. The equipment still starts, and the final setpoint may still be achieved, but the longer recovery period reveals reduced capacity, slower control response, increased system resistance, or deteriorating equipment performance.
In high-density computing, semiconductor testing, medical imaging, and advanced laboratories, those extra minutes can determine whether the critical load remains online.
Recovery time should therefore be treated as a reliability metric, not an incidental observation.
If every changeover takes longer than the one before it, the system is providing advance notice.
The question is whether anyone is measuring it.
Warning Sign 6: Operators Have Developed Workarounds
Some of the most valuable reliability information never appears in the BAS.
It sounds like this:
We try not to run that pump unless we have to.
That valve always hangs up after maintenance.
The BAS says the unit is available, but we do not trust it to take the full load.
We switch the chillers manually because the automatic sequence makes the temperature swing.
That alarm comes in all the time. We acknowledge it and move on.
These comments can be easy to dismiss as preference, habit, or resistance to automation.
Often, they are field data.
Operators work around systems when written sequences and actual behavior do not agree. They learn which equipment is slow, which alarm is unreliable, which transition causes instability, and which “available” machine makes the facility nervous.
The existence of a workaround does not prove that the workaround is correct. It does prove that the formal operating strategy is not fully trusted.
That deserves investigation.
The goal is not to criticize the operator or immediately eliminate the workaround. It is to understand what operating experience caused it to develop.
A reliability review should treat repeated manual intervention, disabled automation, avoided equipment, and nuisance alarms as evidence of unresolved system behavior.
Why the BAS Often Fails to Warn the Owner
Most building automation systems are very good at displaying current status.
They are not automatically configured to reveal long-term loss of margin.
The necessary points may exist but not be trended. Trend intervals may be too long to capture a short control oscillation. Data may be overwritten before anyone recognizes its value. Local equipment controllers may retain information that never reaches the BAS. Point names may be inconsistent. Two systems may use timestamps that are not synchronized.
After the failure, everyone asks for the data.
Then the team discovers that:
- Pump status was recorded, but pump speed was not
- Valve command was trended, but actual valve feedback was not
- Central temperature was retained, but remote-load temperature was not
- Alarms were logged, but recovery time was not measured
- Filter differential pressure existed only as a live value
- Chiller loading remained inside the manufacturer’s controller
- High-resolution trends were overwritten after a few days
- No one had clear responsibility for reviewing gradual changes
Data that exists only until it is overwritten is not a reliability record.
Data that the owner cannot access is not an owner asset.
Data collected without a defined review process is evidence waiting to disappear.
The Most Important Warning Was the Relationship
Return to the system that lost cooling at 2:17 a.m.
The post-event review initially found no single dramatic failure.
The lead chiller had remained online. The standby machine had started. The pump had responded. The central supply-water temperature remained close to setpoint.
Looking at those values independently made the event difficult to explain.
Then the team placed several trends on the same timeline:
- Filter differential pressure
- Pump speed
- Remote control-valve position
- System differential pressure
- Critical-load inlet and outlet temperature
- Chiller staging and recovery time
The pattern became visible.
As filter resistance increased, the pump gradually accelerated to maintain pressure. As the pump lost effective margin, remote valves opened farther. Central-plant readings remained acceptable, but flow distribution to critical branches deteriorated.
The system continued compensating until a normal load transition demanded more than the remaining margin could provide.
The important warning was not one bad value.
It was that the pump was working harder, the valves were asking for more, differential pressure was becoming less stable, and critical-load temperature was taking longer to recover.
Every individual component appeared functional.
The relationship between them showed that the system was running out of room.
The failure did not arrive at 2:17 a.m.
At 2:17, the system simply ran out of ways to hide it.
What Owners Should Require Now
Owners and facility leaders should be able to answer these questions:
- Which operating values establish normal system behavior?
- Are pump speed, valve position, differential pressure, filter loading, equipment staging, and recovery time being trended?
- Are conditions measured at the critical load or only at the central plant?
- Is the trend interval short enough to capture unstable transitions?
- Is data retained long enough to compare seasons, loads, and maintenance cycles?
- Who owns the data from local equipment controllers?
- Who reviews changes that remain below formal alarm thresholds?
- What operator workarounds have become normal practice?
- Which maintenance intervals are becoming shorter?
- How long does the system take to recover after a changeover today compared with six months ago?
- What combination of individually acceptable values would indicate that usable margin is disappearing?
The objective is not to create more alarms.
Facilities already have enough alarms.
The objective is to identify the few relationships that reveal deteriorating performance before another alarm becomes another downtime event.
The Final Question Is Bigger Than Trend Data
Good trend data can reveal a system that is losing margin.
Operator observations can expose behavior the commissioning checklist never captured.
Maintenance history can show that the original assumptions are no longer valid.
But recognizing warning signs after turnover still leaves the owner with a larger problem.
By then, the specification may have been declared complete. The commissioning report may have been accepted. The design teams, contractors, subcontractors, equipment providers, and controls specialists may have received final payment and moved on.
The owner is left with the system—and the evidence that it was never fully proven.
The final article in this series will challenge one of the most established assumptions in project delivery:
Should a mission-critical system be considered complete before it has survived a full environmental and operational cycle?
That question will not be popular.
It affects contracts, final acceptance, financial holdbacks, warranties, commissioning scope, and how long the parties responsible for delivering performance remain accountable.
But if some of the most consequential failure modes cannot reveal themselves during a short commissioning window, the industry may be using the wrong finish line.
Part 4 will make the case for a different one.
Martin P. King works with facility and engineering teams to uncover hidden reliability risks in mission-critical cooling infrastructure.