
KMC² Engineering Case Analysis
The Hidden Control-Layer Problem: How PID Loop Performance Can Affect Data Center PUE
This six-chiller hyperscale analysis examines how PID tuning, staging logic and synchronized trend data can affect data center PUE—and why system-level verification matters more than any single setpoint.
At a Glance
Executive Summary
In a hyperscale data center, cooling efficiency is not determined by chiller efficiency alone. It is the product of hundreds of decisions made continuously by sensors, controllers, variable-frequency drives, valves, equipment staging routines, overrides and operators. Each device can appear to be working while the overall plant consumes more power than necessary.
That is why proportional-integral-derivative (PID) tuning deserves more attention than it usually receives. A PID loop compares a measured condition with a target and adjusts equipment output to close the difference. When that loop is poorly tuned, working from a bad signal, constrained by the wrong limits or interacting with another loop, the result can be hunting, saturation, unnecessary pump and fan speed, premature equipment staging, unstable supply conditions and lost economizer opportunity.
Those effects can increase the non-IT portion of facility power and therefore affect power usage effectiveness (PUE). But the relationship cannot be established from a screenshot, a single trend or a low PUE day. It requires synchronized operating data, a verified sequence of operations, defensible electrical boundaries and an analytical process that separates control behavior from IT load, weather, redundancy posture and equipment availability.
The case analysis below describes how KMC² would investigate that problem without overstating the evidence, disrupting a live data center or transferring responsibility for control changes away from the site’s authorized controls and operations teams.
The Operating Context: More Loads, More Loops, More Interaction
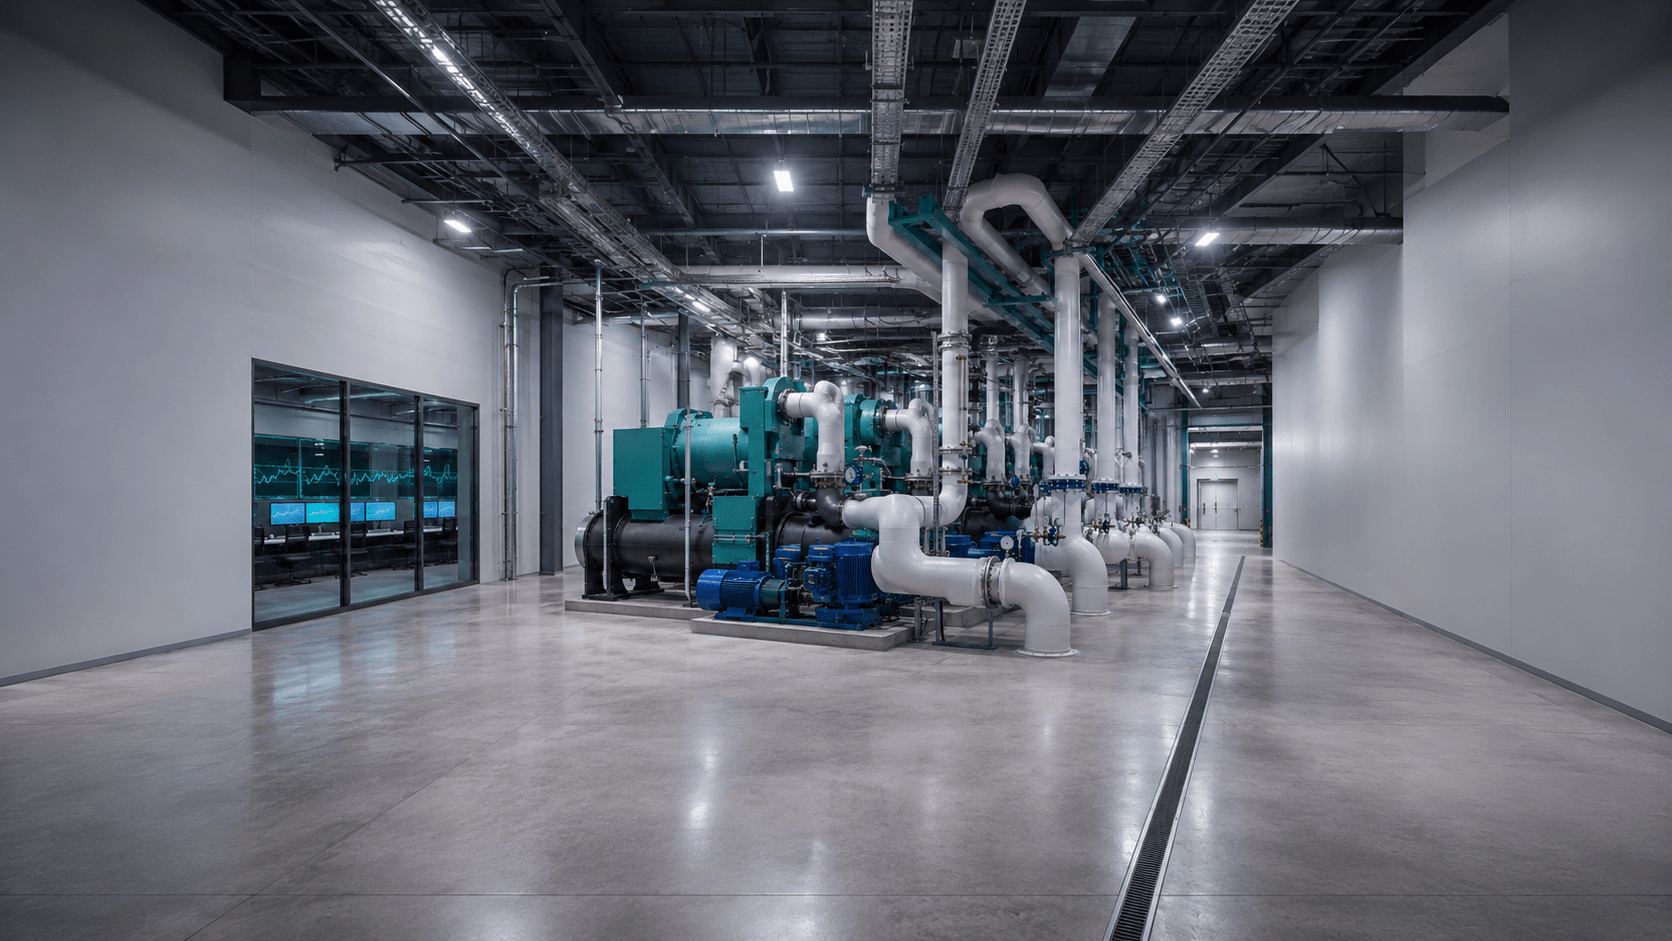
The evaluated control environment was modeled as a six-chiller mission-critical plant supporting a mixed thermal load. Traditional computer room air-conditioning (CRAC) and computer room air-handling (CRAH) systems remained important, while direct-to-chip liquid cooling added coolant distribution units (CDUs), secondary pumps, heat exchangers and a new set of temperature, pressure and flow requirements.
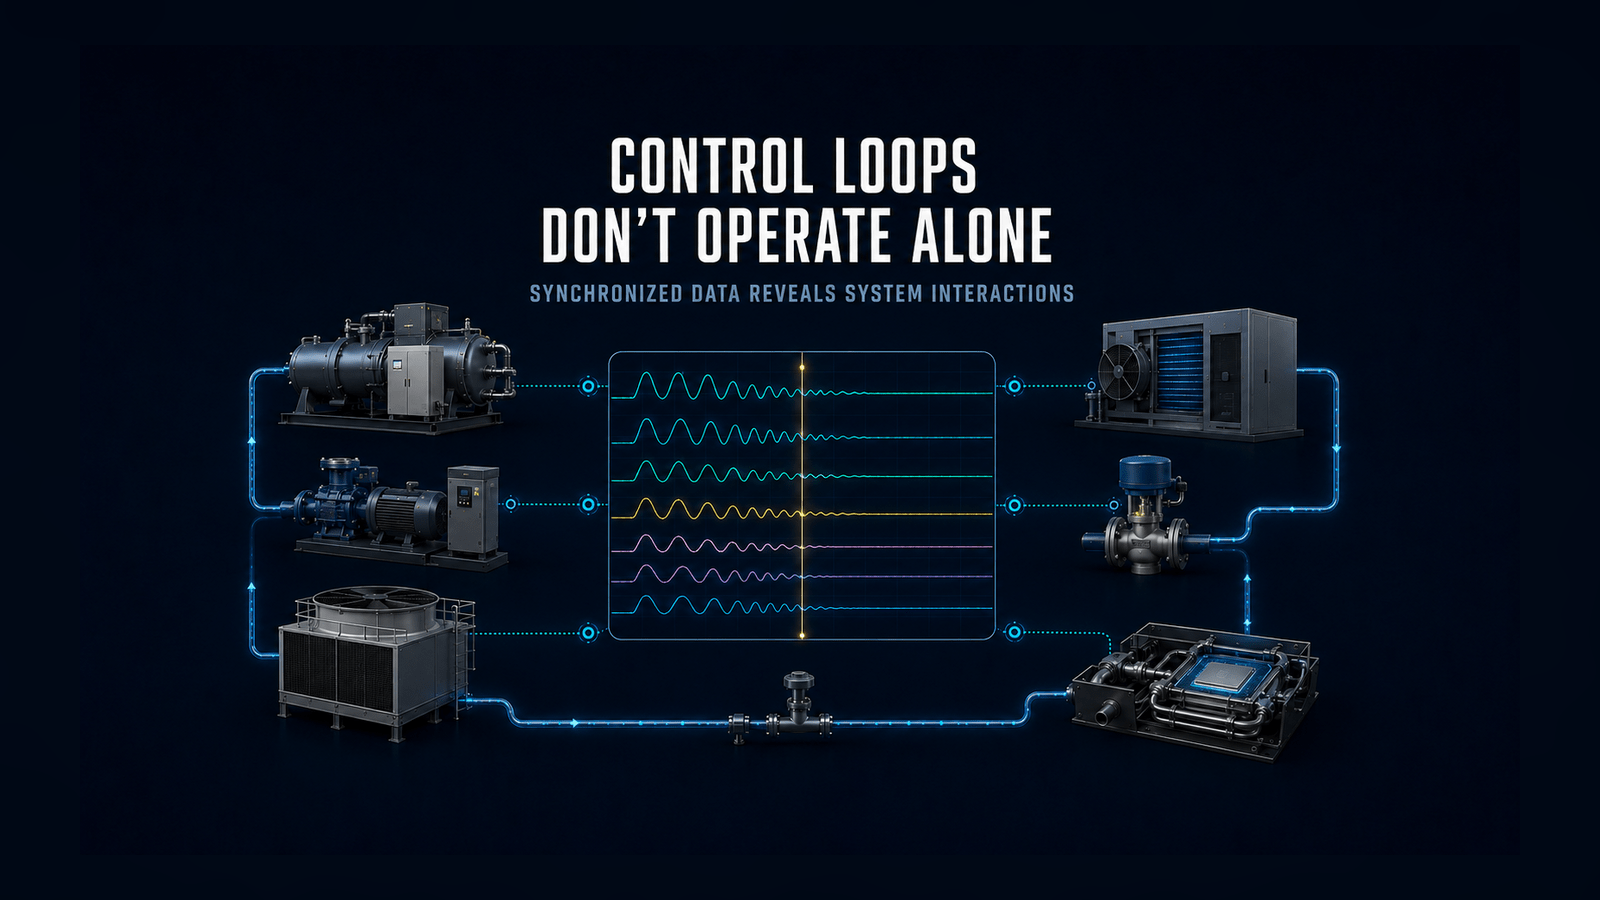
That combination matters. Air-side systems respond to rack inlet temperatures, static pressure, fan demand and chilled-water valve position. Chilled-water pumps respond to differential pressure. Chillers respond to leaving-water temperature and capacity demand. Cooling towers and condenser-water pumps respond to heat rejection requirements and outdoor conditions. CDUs respond to secondary-loop supply temperature, pressure or flow. Each loop sees only part of the system.
A change at one end can propagate through every layer. A static-pressure loop that pushes CRAH fans toward maximum may increase airflow while simultaneously reducing coil temperature difference. A differential-pressure setpoint that is too high may force control valves toward closed positions while pumps continue to spend energy maintaining pressure that the load does not need. A tight chilled-water temperature loop may cause chiller capacity movement that collides with staging logic or minimum-loading limits.
With direct-to-chip cooling, the operating envelope becomes even more consequential. Raising a primary chilled-water temperature can improve plant efficiency in some configurations, but the change must remain compatible with CDU approach temperature, secondary coolant limits, flow requirements, rack qualification and failure response. The most efficient setpoint is irrelevant if it compromises thermal margin.
How PID Performance Can Affect Data Center PUE
Data center PUE is the ratio of total data center energy to IT equipment energy. The current international reference is ISO/IEC 30134-2:2026, which defines measurement and reporting requirements for the metric.
PID tuning does not directly change the IT denominator. It can affect data center PUE by changing parts of the facility numerator: chiller compressors, chilled-water pumps, condenser-water pumps, cooling-tower fans, CRAH and CRAC fans, CDU pumps and other supporting equipment.
This is an important boundary. If IT load drops while cooling equipment continues running at nearly the same power, PUE can worsen even when total facility power also drops. If IT load rises into a more favorable plant operating range, PUE can improve without any control change. A credible data center PUE analysis therefore compares like operating periods and normalizes for IT load, weather and equipment availability.
Annual data center PUE remains the appropriate reporting view. Short-interval or instantaneous PUE can still be useful diagnostically, provided it is labeled correctly. The U.S. Department of Energy has similarly distinguished annual PUE from snapshot calculations used during field assessment.
PID Tuning in Plain English
A controller starts with an error: the difference between what the system is producing and what the operator or sequence is asking it to produce. The controller then adjusts an output—such as valve position, pump speed, fan speed or compressor capacity—to reduce that error.
Proportional action
Responds to the present error. Too little can make the loop slow. Too much can create overshoot or oscillation.
Integral action
Accumulates error over time and removes persistent offset. Too aggressive an integral term can continue driving after conditions have already changed.
Derivative action
Responds to the rate of change. It can add damping, but noisy field signals often limit its usefulness. Many HVAC loops operate as PI loops even when the controller supports full PID.
Limits and resets
Output limits, deadbands, minimum speeds, anti-windup, sensor filtering and setpoint resets can matter as much as the three tuning terms.
The objective is not a perfectly flat line at all costs. The objective is a stable, responsive process that satisfies the load with acceptable energy use, equipment movement and operating margin. A loop tuned for an empty facility may not behave well at high density. A loop tuned around one chiller may behave differently after a second chiller stages. A stable loop may become unstable when another controller starts resetting its setpoint.
The Problem: Symptoms That Look Like Equipment Issues
The initial concern was not “the PID gains are wrong.” That conclusion would have been premature. The concern was that the control layer could be contributing to a material mechanical-energy gap while the available documentation did not prove how the live plant was actually operating.
Design drawings described original intent. A later sequence document described proposed operation. Field remarks suggested that portions of the active sequence had evolved into semi-automatic or operator-assisted control. None of those sources, by itself, established the current program.
Several observations could have been consistent with poor loop performance, but each also had competing explanations:
A control signal appears low while the associated fan or pump is near maximum output.
The loop, reset logic or command path may not be producing the intended response.
Sensor error or location, leakage, restriction, floor configuration, a manual override or a genuine capacity shortage.
The same discipline applies to oscillating temperatures, cycling chillers, nearly closed valves, high pump speeds and unstable static pressure. They are diagnostic clues—not self-proving root causes.
Why Screenshots and Short Trend Reviews Are Not Enough
A building management system screenshot can show that a valve was 22% open at 10:14 a.m. It cannot show how long the valve remained there, what the pump was doing, whether a reset routine moved the pressure target, whether a chiller staged five minutes earlier, or whether the IT load changed at the same time.
Trend duration matters because control problems have time signatures. Some loops cycle every few minutes. Others drift over hours as integral action accumulates. Staging issues may occur only at particular load thresholds. Economizer conflicts may appear only within a narrow outdoor wet-bulb range. A monthly PUE number can confirm that a problem exists while concealing its mechanism.
Lawrence Berkeley National Laboratory has documented the use of operational data analytics in high-performance computing cooling systems, including the integration and archiving of facility and computing data to support safe, ongoing optimization. That model reinforces the key principle here: the cooling plant and the computing load must be evaluated on the same clock.
The Minimum Defensible Data Set
The analysis should begin with existing history before creating a new data-collection burden. If the available history lacks synchronized timestamps, adequate resolution or critical points, a focused capture of approximately 30 days is practical; 60 days is preferable when weather, staging and workload variation need broader coverage.
Load and power
IT load, total facility power and individual or grouped power for chillers, pumps, towers, CRAHs, CRACs and CDUs.
Process variables
Supply and return temperatures, flow, differential pressure, static pressure, humidity where relevant, and outdoor dry-bulb and wet-bulb conditions.
Control variables
Setpoints, reset targets, controller outputs, valve positions, fan and pump speeds, capacity commands and actual equipment response.
Operating state
Equipment enable status, staging, modes, alarms, safeties, manual overrides, sensor quality flags and maintenance outages.
Raw timestamps, engineering units and sample intervals must be retained. Averaged exports can erase the very oscillations the investigation is trying to identify. Where possible, controller data should be aligned with electrical metering rather than estimated only from nameplate or variable-frequency-drive speed.
A Seven-Step System-Level Analysis
- Establish the evidence boundary. Separate verified field behavior from design intent, proposed sequences, operator recollection and engineering hypotheses.
- Normalize the time base. Align IT load, plant power, weather, commands, feedback and operating modes. Correct clock offsets before interpreting cause and effect.
- Segment comparable operating periods. Compare similar IT load, outdoor conditions, redundancy posture and equipment availability. Do not mix normal operation with maintenance or failure response.
- Characterize each loop. Evaluate control error, settling time, oscillation period, output movement, saturation, deadband, valve travel and response delay.
- Test loop interactions. Identify whether one loop’s response drives another away from its efficient range—for example, pressure reset versus valve position or leaving-water temperature versus chiller staging.
- Attribute energy carefully. Relate observed behavior to metered chiller, pump, tower and air-handler power. Treat correlation as a lead until a physical mechanism and repeatability support it.
- Validate controlled changes. Have authorized control specialists implement one bounded change at a time, with rollback criteria, thermal guardrails and an agreed observation period.
Control Patterns Worth Investigating
Hunting
The process variable repeatedly crosses the setpoint while the command continually reverses. The energy penalty may come from excessive fan, pump or compressor movement and from downstream loops reacting to the disturbance.
Saturation
The controller output remains at or near 0% or 100%. The loop may lack authority, the setpoint may be unattainable, the sensor may be misleading or another constraint may be active.
Valve-pressure mismatch
Most control valves remain nearly closed while distribution pumps maintain high differential pressure. This can indicate excess pressure, a poor reset strategy or a hydraulically dominant path.
Stage-loop conflict
A stable temperature loop repeatedly approaches a staging threshold and brings equipment on or off. The underlying issue may be threshold logic, delays, minimum run time or plant minimum load—not the PID term alone.
Sensor-command disconnect
A controller makes large output changes with little physical response. Check sensor location, calibration, actuator travel, valve authority, bypass flow and command mapping before tuning.
Override debt
Manual setpoints or forced outputs solve an immediate operational problem but become permanent. The system may appear stable while automatic optimization and failover capability are partially disabled.
What the Data Center PUE Impact Could Look Like
The following example is an analytical scenario, not a reported client result. It shows why even a modest system-level control opportunity can matter at hyperscale.
Illustrative 20 MW IT-load scenario
Assume a facility operates at 20 MW of IT load and 27 MW of total facility power. Its instantaneous diagnostic PUE is 1.35. If validated control and sequence improvements reduce mechanical support power by 1 MW while IT load and other boundaries remain comparable, total facility power becomes 26 MW and the diagnostic PUE becomes 1.30.
Cost context: At an illustrative $0.08/kWh and 8,760 hours, that 1 MW reduction equals approximately $700,800 per year. Actual value depends on persistence, energy tariffs, demand charges, seasonal operation and whether the reduction can be sustained without compromising resilience.
Large PUE changes should not be attributed to PID tuning alone. DOE assessments have shown substantial facility-level PUE potential from packages of energy-efficiency measures, including airflow, temperature, equipment and operational changes. PID performance belongs inside that broader system—not outside it and not as a magic explanation.
Reliability Guardrails Come First
No efficiency change should weaken the facility’s required redundancy or thermal response. Before a control specialist changes gains, resets, delays or staging thresholds, the team should define:
- Acceptable rack-inlet, supply-water and secondary-coolant temperature limits.
- Minimum flow, pressure and equipment-speed constraints.
- N+1 or other redundancy requirements under normal and degraded conditions.
- Failure detection, automatic response and recovery expectations.
- Rollback triggers and who has authority to initiate them.
- A change window that reflects IT workload and operational risk.
Energy efficiency and reliability are not opposing goals, but they are not automatically aligned. A plant can waste energy because it is operating too conservatively. It can also appear efficient because required standby capacity, thermal margin or failure recovery has been compromised. Both outcomes are unacceptable.
Findings, Hypotheses and What Remained Unproven
The available material supported a credible investigation into control-loop and staging performance. It did not support a claim that poor PID tuning was the root cause of a specific PUE gap.
Cooling and computing data must be synchronized. The active field sequence must be verified. Control behavior should be evaluated across the full thermal chain.
Chiller and pump staging, pressure control, CRAH/CRAC airflow control and loop interaction could be contributing to excess mechanical power.
Duration, causal mechanism, affected equipment, energy magnitude, annual persistence and achievable PUE improvement.
That conclusion is not a weakness. It is the point at which a defensible engineering review separates itself from a sales claim. The right next step is not to turn knobs. It is to close the evidence gaps, develop bounded tests and place implementation responsibility with the site’s authorized controls and operations teams.
Recommended Corrective-Action Path
- Confirm the live sequence. Extract current controller logic, document active resets and identify every manual override or operator-dependent step.
- Validate the sensors and actuators. Confirm calibration, location, scaling, command mapping, valve stroke and variable-frequency-drive feedback.
- Build the synchronized baseline. Use existing data first; add targeted trends only where necessary.
- Prioritize high-energy loops. Start with loops controlling large fan, pump and compressor loads or loops capable of triggering equipment staging.
- Correct sequence defects before fine tuning. A well-tuned PID loop cannot repair the wrong setpoint, failed sensor, undersized valve, excessive bypass or conflicting stage logic.
- Run bounded tests. Change one mechanism at a time and compare matched conditions.
- Verify persistence. Confirm the improvement across workload, weather and equipment combinations—not just for one favorable hour.
- Institutionalize monitoring. Create simple exception rules for sustained saturation, oscillation, excessive overrides, pressure-valve mismatch and abnormal energy intensity.
Lessons for Data Center PUE and AI Cooling
1. Data center PUE identifies a gap; it does not identify the mechanism.
A rising PUE can focus attention, but its cause may be mechanical, electrical, workload-related, weather-related or metering-related. Controls analysis needs end-use power and operating context.
2. The sequence of operations is a living asset.
Design intent, proposed modifications and live programming often diverge over time. Treat the current field sequence as evidence that must be extracted and verified.
3. Control loops must be evaluated as a network.
Optimizing a single chiller, pump or CRAH can shift energy or instability somewhere else. The correct boundary is the full path from IT heat generation to ambient heat rejection.
4. Liquid cooling increases the need for coordination.
CRAC and CRAH systems do not disappear immediately as direct-to-chip loads grow. Mixed cooling architectures create more interfaces, more minimum-flow conditions and more opportunities for primary and secondary controls to compete.
5. Continuous optimization is more realistic than one-time tuning.
Workloads, server generations, containment, equipment availability and operating modes change. The control system must be re-evaluated as the facility changes. LBNL’s operational-data-analytics work similarly frames commissioning, optimization and operations as a continuing process.
The KMC² Perspective
KMC² approaches data center PUE and controls performance from the mechanical system outward. PID values are not reviewed in isolation. The investigation begins with the process: heat transfer, water flow, temperature difference, pressure, equipment loading, valve authority, sensor placement, failure response and the physical reason each loop exists.
That perspective is grounded in more than four decades of chiller, fluid-cooling, controls and mission-critical reliability experience. It is especially valuable when modern AI infrastructure combines central chilled water, air cooling, CDUs, direct-to-chip loops and operating requirements that were not present when portions of the facility were originally commissioned.
KMC²’s role is to identify patterns, test hypotheses, quantify credible opportunities and point the responsible site teams toward the right corrective actions. Authorized controls contractors, operators and equipment specialists retain responsibility for programming, setpoint changes, functional testing and equipment operation.
Selected Technical References
- ISO/IEC 30134-2:2026 — Power Usage Effectiveness.
- Lawrence Berkeley National Laboratory — Operational Data Analytics: Optimizing the NERSC Cooling Systems.
- U.S. Department of Energy — Retro-Commissioning Increases Data Center Efficiency at Low Cost.
- U.S. Department of Energy — Opportunities to Improve Energy Efficiency in Three Federal Data Centers.
Could Controls Be Affecting Your Data Center PUE?
KMC² helps mission-critical operators turn fragmented trend data into a defensible picture of cooling performance, reliability risk and practical next steps.